
Confusion Matrix Python Tutorial: Metrics, Visualization, and Examples

A confusion matrix Python is a useful tool for evaluating the performance of a machine learning classification model. It compares a model’s predicted labels with the actual labels to show which predictions are correct and which are incorrect. This makes it easier to understand how a classifier behaves beyond a single accuracy score.
Developers commonly use confusion matrices when building models for spam detection, medical image classification, fraud detection, sentiment analysis, and other classification tasks. Python libraries such as Scikit-learn, Matplotlib, and Seaborn make it straightforward to calculate and visualize these results.
In this tutorial, you will learn how a confusion matrix works, how to create one in Python, how to interpret its results, and how to calculate important evaluation metrics such as precision, recall, accuracy, and F1 score.
What Is a Confusion Matrix?
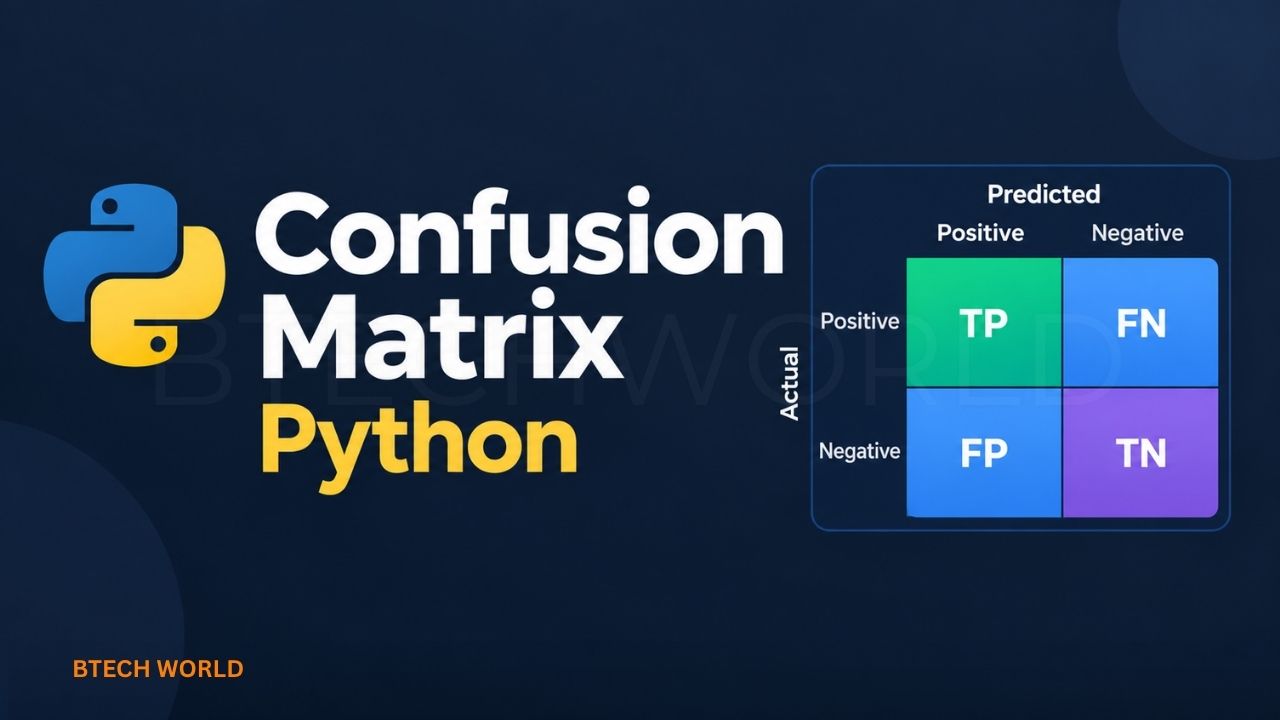
A confusion matrix is a table that summarizes the predictions made by a classification model. For a binary classification problem, it compares two possible actual classes with two possible predicted classes.
Consider a model that predicts whether an email is spam or not spam. The confusion matrix shows how many spam emails the model correctly identifies, how many normal emails it correctly recognizes, and how many messages it classifies incorrectly.
The matrix contains four main values: True Positive (TP), True Negative (TN), False Positive (FP), and False Negative (FN). These values help developers understand the types of errors a model makes and whether those errors are acceptable for the task.
Understanding the Four Main Confusion Matrix Values
In binary classification, the confusion matrix contains four outcomes. Imagine a model that predicts whether a patient has a particular condition.
| Term | Meaning | Example |
|---|---|---|
| True Positive (TP) | Correctly predicts the positive class | Detects a patient with the condition |
| True Negative (TN) | Correctly predicts the negative class | Identifies a patient without the condition |
| False Positive (FP) | Predicts positive when the actual class is negative | Flags a healthy patient incorrectly |
| False Negative (FN) | Predicts negative when the actual class is positive | Misses a patient who has the condition |
These values help identify the types of mistakes a model makes. In medical screening, false negatives may be especially concerning. In spam filtering, false positives can cause legitimate emails to be marked as spam.
How to Create a Confusion Matrix in Python
Python’s Scikit-learn library provides the confusion_matrix() function, which compares actual labels with predicted labels and returns the number of observations in each category.
First, install the required libraries if they are not already available:
pip install scikit-learn matplotlib seabornNext, create a simple example using actual and predicted values.
from sklearn.metrics import confusion_matrix# Actual class labelsy_true = [0, 0, 0, 0, 1, 1, 1, 1]# Predicted class labelsy_pred = [0, 0, 0, 1, 0, 1, 1, 1]# Calculate the confusion matrixcm = confusion_matrix(y_true, y_pred)print(cm)Output:
[[3 1]
 [1 3]]
The first row represents actual class 0, while the second represents actual class 1. The columns represent predicted classes 0 and 1, respectively.
This result means that three negative cases and three positive cases were classified correctly. One negative case was incorrectly predicted as positive, and one positive case was incorrectly predicted as negative.
How to Visualize a Confusion Matrix Using Python
A heatmap makes confusion matrix results easier to interpret. Seaborn can display the matrix as a color-coded table, with each cell showing the number of predictions.
import matplotlib.pyplot as pltimport seaborn as snsfrom sklearn.metrics import confusion_matrixy_true = [0, 0, 0, 0, 1, 1, 1, 1]y_pred = [0, 0, 0, 1, 0, 1, 1, 1]cm = confusion_matrix(y_true, y_pred)sns.heatmap( cm, annot=True, fmt="d", cmap="Blues", xticklabels=["Negative", "Positive"], yticklabels=["Negative", "Positive"])plt.xlabel("Predicted Label")plt.ylabel("Actual Label")plt.title("Confusion Matrix")plt.tight_layout()plt.show()The resulting visualization displays the number of predictions in each cell. Darker or lighter colors depend on the selected color map and the values in the matrix.
The diagonal cells represent correct predictions, while the off-diagonal cells represent classification errors. For more control, Scikit-learn also provides ConfusionMatrixDisplay for plotting matrices directly.
Important Metrics Calculated From a Confusion Matrix
A confusion matrix supports several performance metrics. Each metric measures a different aspect of classification, so it is useful to consider them together.
Accuracy
Accuracy measures the proportion of all predictions that are correct.
\[ \text{Accuracy}=\frac{TP+TN}{TP+TN+FP+FN} \]
For the example above, six out of eight predictions are correct, giving an accuracy of 75%.
Precision
Precision measures how many predicted positive cases are actually positive.
\[ \text{Precision}=\frac{TP}{TP+FP} \]
In the example, precision is \(3/(3+1)=75\%\). Higher precision means fewer false positives among the positive predictions.
Recall
Recall measures how many actual positive cases the model correctly identifies.
\[ \text{Recall}=\frac{TP}{TP+FN} \]
Here, recall is \(3/(3+1)=75\%\). Recall is particularly important when missing a positive case carries a high cost.
F1 Score
The F1 score combines precision and recall using their harmonic mean.
\[ F1=2\times\frac{\text{Precision}\times\text{Recall}}{\text{Precision}+\text{Recall}} \]
Because both precision and recall are 75% in this example, the F1 score is also 75%.
You can calculate these metrics using Scikit-learn:
from sklearn.metrics import ( accuracy_score, precision_score, recall_score, f1_score)print("Accuracy:", accuracy_score(y_true, y_pred))print("Precision:", precision_score(y_true, y_pred))print("Recall:", recall_score(y_true, y_pred))print("F1 Score:", f1_score(y_true, y_pred))For more complex datasets, these metrics can be calculated using different averaging methods, including macro, micro, and weighted averages.
Confusion Matrix for Multiclass Classification
Confusion matrices are not limited to two classes. They can also evaluate models that classify multiple categories, such as recognizing images of cats, dogs, and birds.
For a multiclass problem, the matrix contains one row and one column for each class. The diagonal cells show correct predictions, while off-diagonal cells show which categories the model confuses with one another.
For example, an image classifier might frequently predict a wolf as a dog because the two categories share visual characteristics. A multiclass confusion matrix can reveal this pattern and help developers identify where the model needs improvement.
When evaluating multiple classes, examine individual class performance rather than relying only on overall accuracy.
Common Mistakes When Using a Confusion Matrix
A confusion matrix is easy to calculate, but interpreting it correctly requires attention to a few details.
- Ignoring class imbalance: A model can achieve high accuracy while performing poorly on a rare class.
- Reversing actual and predicted labels: Always check the matrix’s row and column order.
- Relying only on accuracy: Precision, recall, and F1 score may reveal errors that accuracy hides.
- Using training data for evaluation: Evaluate predictions on an appropriate test set to estimate how the model performs on unseen data.
- Ignoring the cost of errors: False positives and false negatives may have very different consequences in real applications.
Scikit-learn also supports normalized confusion matrices, which display proportions rather than raw counts. This can make comparisons easier when class sizes differ.
Conclusion
A confusion matrix Python is a practical way to evaluate classification models and understand their prediction errors. With Scikit-learn, developers can calculate the matrix quickly, visualize results with Seaborn or Matplotlib, and use the values to calculate accuracy, precision, recall, and F1 score.
The most useful evaluation approach depends on the problem being solved. By examining individual error types, checking class balance, and testing models on unseen data, developers can make more informed decisions about model performance.
Frequently Asked Questions (FAQs)
Q1. What is a confusion matrix in Python?
A confusion matrix is a table that compares actual class labels with predicted labels to summarize correct predictions and classification errors.
Q2. Which Python library is used to create a confusion matrix?
Scikit-learn provides the confusion_matrix() function. Matplotlib and Seaborn can be used to visualize its results.
Q3. What are TP, TN, FP, and FN?
They stand for true positive, true negative, false positive, and false negative. These values represent the four possible outcomes of a binary classification model.
Q4. Can a confusion matrix be used for multiclass classification?
Yes. A multiclass confusion matrix includes a row and column for every class, allowing developers to see which categories the model predicts correctly or confuses with others.
Q5. Why is a confusion matrix better than accuracy alone?
Accuracy summarizes the proportion of correct predictions, but it does not show the types of errors a model makes. A confusion matrix provides more detail and helps developers assess precision, recall, and class-specific performance.
Explore More BTECH WORLD