
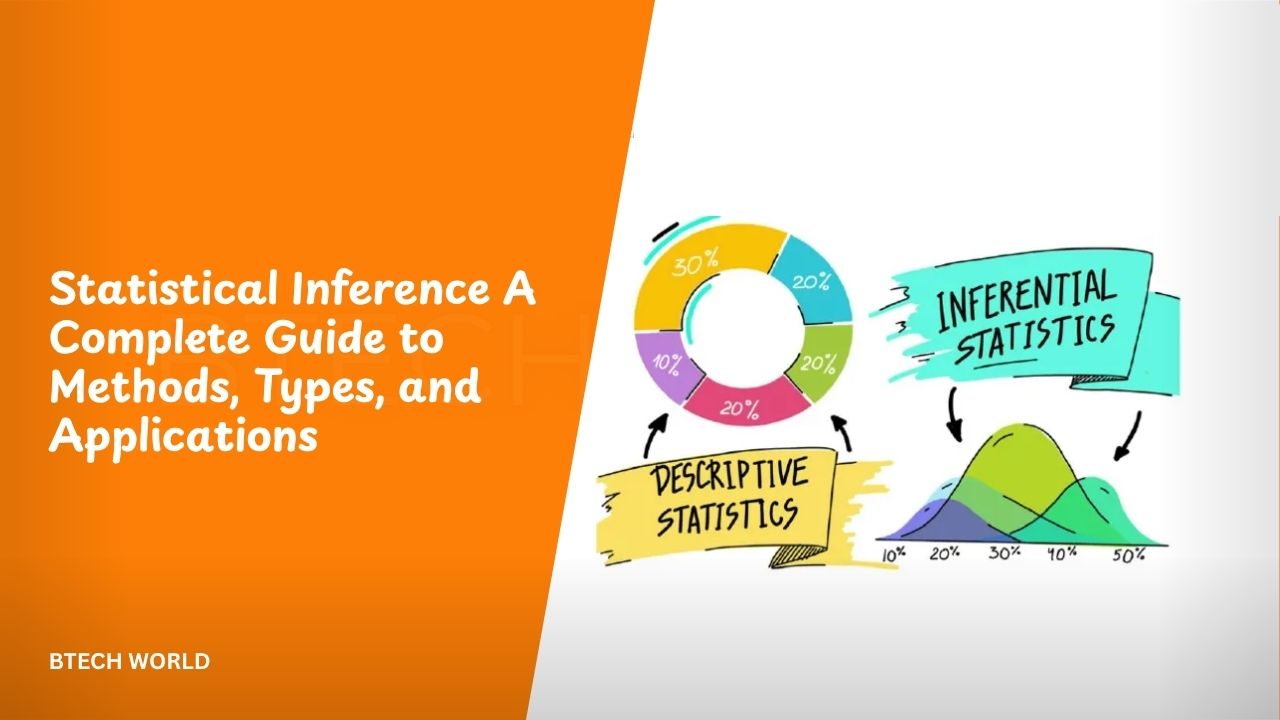
Statistical Inference A Complete Guide to Methods, Types, and Applications

Statistical inference is the process of using sample data to draw conclusions about a larger population. Researchers rarely have enough time, money, or resources to study every member of a population. Instead, they collect a representative sample and use statistical methods to estimate population characteristics or evaluate specific claims. Inferential statistics uses probability to measure uncertainty and help researchers understand how reliable their conclusions are.
Statistical inference is widely used in science, business, medicine, education, economics, technology, and social research. Common methods include point estimation, confidence intervals, hypothesis testing, and statistical modeling. Understanding these methods makes it easier to interpret data and distinguish useful evidence from conclusions that may be affected by sampling variation.
What Is Statistical Inference?
Statistical inference connects a sample with the population from which it was collected. A population represents the complete group being studied, while a sample represents a smaller portion of that group.
For example, a company may want to know the average satisfaction level of 50,000 customers. Asking every customer may not be practical. The company could survey a carefully selected sample and use the results to estimate the satisfaction level of the larger customer population.
The quality of the inference depends heavily on how the sample was collected. A poorly selected sample can produce misleading results even when the mathematical calculations are correct. OpenStax notes that inferential statistics uses formal methods and probability to draw conclusions from data.
Statistical Inference vs Descriptive Statistics
Descriptive and inferential statistics have different purposes.
Descriptive statistics summarize the data that have already been collected. Common examples include the mean, median, percentage, standard deviation, tables, and charts.
Statistical inference, on the other hand, uses sample information to make conclusions about a broader population.
| Feature | Descriptive Statistics | Statistical Inference |
|---|---|---|
| Main purpose | Summarize collected data | Draw conclusions about a population |
| Main focus | Sample or observed dataset | Population based on sample evidence |
| Common tools | Mean, median, charts | Confidence intervals, hypothesis tests |
| Uncertainty | Usually describes observed data | Explicitly considers uncertainty |
| Example | Average income in a survey | Estimated average income of a population |
Both areas are important. Descriptive statistics can help researchers understand the sample before they perform inferential analysis.
Main Types of Statistical Inference
Statistical inference includes several methods, but two major categories are estimation and hypothesis testing. NIST describes interval estimation and hypothesis testing as two broad categories of classical quantitative statistical techniques.
Estimation attempts to determine a reasonable value or range for an unknown population parameter. Hypothesis testing examines whether sample evidence provides enough reason to question a particular claim.
Other methods can extend these ideas through regression, analysis of variance, resampling, Bayesian techniques, and other statistical models.
Point Estimation
A point estimate uses a single value from a sample to estimate an unknown population parameter.
For example, suppose a researcher wants to estimate the average age of customers in a population. The researcher could calculate the sample mean and use it as a point estimate of the population mean.
A point estimate is easy to understand, but it does not show how much uncertainty surrounds the estimate. Two samples from the same population can produce different results.
For this reason, researchers often combine point estimates with confidence intervals. OpenStax describes a point estimate as a single value used to estimate a population parameter.
Confidence Intervals
A confidence interval provides a range of plausible values for a population parameter based on sample data.
Suppose a survey estimates that the average customer spending is $75. Instead of reporting only $75, a researcher may calculate a 95% confidence interval around that estimate.
The confidence level describes the long-run performance of the interval procedure. NIST explains that if the same population were repeatedly sampled and intervals were constructed using the same method, a 95% confidence procedure would capture the true population parameter in approximately 95% of those cases.
A confidence interval generally becomes wider when the data contain greater variability or when the sample provides less precise information. Larger samples can often produce narrower intervals when other conditions remain similar.
Hypothesis Testing
A typical test begins with a null hypothesis, written as H₀, and an alternative hypothesis, written as Hₐ. Researchers then collect sample data and calculate a test statistic or p-value using an appropriate statistical distribution.
The goal is not simply to prove that one hypothesis is true. Instead, researchers evaluate whether the sample provides sufficient evidence to reject the null hypothesis under the chosen testing procedure. OpenStax describes hypothesis testing as a process involving competing hypotheses, sample data, an appropriate distribution, analysis, and a conclusion.
This distinction matters because failing to reject a null hypothesis does not establish that the null hypothesis is certainly true.
Null and Alternative Hypotheses
The null hypothesis usually represents a specific condition or claim that the statistical test evaluates.
The alternative hypothesis represents a competing possibility.
For example:
- H₀: The population mean equals 50.
- Hₐ: The population mean does not equal 50.
The alternative hypothesis can also specify a directional difference, depending on the research question.
Researchers then use the sample data to determine whether the evidence is sufficiently inconsistent with the null hypothesis at the selected significance level.
P-Values and Significance Levels
A p-value helps researchers evaluate how unusual the observed sample result would be under the assumptions of the null hypothesis.
A small p-value can provide evidence against the null hypothesis. However, a p-value is not the probability that the null hypothesis is true.
Researchers also choose a significance level, often represented by α. A commonly used value is 0.05, although the appropriate level depends on the research context. NIST identifies 0.05 as a commonly used significance level in hypothesis testing.
Statistical significance should also be interpreted alongside practical importance, sample size, study design, and the quality of the underlying data.
Sampling Distributions
A sampling distribution describes how a statistic, such as a sample mean, behaves across repeated samples from a population.
Researchers use these distributions to understand sampling variability and calculate probabilities, standard errors, confidence intervals, and hypothesis tests.
The Central Limit Theorem is especially important because, under appropriate conditions, it explains why the distribution of sample means tends to become approximately normal as sample size increases. The exact conditions still matter, so researchers should not treat the theorem as a guarantee for every dataset.
Standard Error
The standard error describes the expected variability of a sample statistic across repeated samples.
For a sample mean, the standard error is commonly related to the population standard deviation divided by the square root of the sample size:
SE = σ / √n
When the population standard deviation is unknown, researchers often estimate it using the sample standard deviation.
Increasing sample size generally reduces the standard error, which can make estimates more precise when other assumptions remain appropriate.
Common Probability Distributions
Statistical inference relies on probability distributions to model sampling behavior.
For example, a normal distribution may be used for certain tests involving population means when the required assumptions are satisfied. The Student’s t-distribution is commonly used when the population standard deviation is unknown and the sample mean has an approximately normal sampling distribution.
For proportions, normal-based methods can also be appropriate under suitable conditions. OpenStax provides different distributions for different hypothesis-testing situations and assumptions.
Choosing the correct distribution is important because an inappropriate model can produce unreliable results.
Type I and Type II Errors
A Type I error occurs when a researcher rejects a true null hypothesis. It is sometimes described as a false positive.
A Type II error occurs when a researcher fails to reject a false null hypothesis. It is sometimes described as a false negative.
The probability of a Type I error is connected to the selected significance level. The probability of detecting an effect when one exists is related to statistical power.
Understanding these errors helps researchers interpret statistical results more carefully.
Statistical Inference Methods
Several methods can be used depending on the research question and data.
| Method | Main Purpose | Common Example |
|---|---|---|
| Point estimation | Estimate one population parameter | Sample mean |
| Confidence interval | Estimate a parameter using a range | 95% interval for a mean |
| Hypothesis testing | Evaluate a population claim | One-sample test |
| t-test | Compare means under suitable conditions | Comparing two groups |
| Chi-square test | Analyze categorical data | Test of independence |
| Regression | Study relationships between variables | Predicting an outcome |
| ANOVA | Compare multiple group means | Comparing three treatments |
| Bootstrapping | Estimate uncertainty through resampling | Confidence interval |
The appropriate method depends on the research question, measurement type, sampling design, sample size, and assumptions.
Assumptions in Statistical Inference
Statistical methods do not work independently of assumptions.
Depending on the method, researchers may need to consider independence, random sampling, distributional assumptions, equal variances, sample size, or other conditions.
For example, a statistical test designed for independent observations may not be appropriate when observations are strongly related.
Researchers should therefore examine the data and study design before selecting a method. NIST notes that differences between exploratory analysis and classical statistical results can sometimes indicate that assumptions have been violated.
Applications of Statistical Inference
Statistical inference has applications across many fields.
In medicine, researchers can use samples from clinical studies to estimate treatment effects and evaluate medical hypotheses.
In business, companies can analyze customer samples to estimate satisfaction, demand, or purchasing behavior.
In manufacturing, statistical methods can help evaluate product quality and process performance. NIST describes applications in which test data are used to calculate point estimates and confidence bounds for evaluating instrument performance.
In education, researchers can compare student outcomes across groups or estimate broader performance from samples.
In data science, inferential techniques can help analysts understand relationships and quantify uncertainty instead of relying only on observed sample values.
Statistical Inference in Data Science
Modern data science often combines statistical inference with programming, machine learning, and visualization.
A machine-learning model may focus primarily on prediction, while statistical inference can focus on understanding relationships, estimating parameters, and quantifying uncertainty.
For example, a data scientist could use a sample of customer transactions to estimate an average purchase value and construct a confidence interval. They might also test whether a marketing campaign is associated with a measurable change.
This approach helps organizations move beyond simple descriptions and make evidence-based conclusions while recognizing uncertainty.
Why Sample Size Matters
Sample size strongly affects statistical precision.
A very small sample may produce an unstable estimate, especially when the underlying data have substantial variation. Increasing the sample size can reduce sampling variability and improve the precision of many estimates.
However, a larger sample does not automatically fix biased sampling. If the sample systematically excludes important parts of the population, increasing its size may simply produce a more precise estimate of the wrong target.
Researchers therefore need both an appropriate sample size and a suitable sampling design.
Confidence Intervals and Hypothesis Tests
Confidence intervals and hypothesis tests are closely related.
For many standard tests, the confidence interval provides a range of parameter values compatible with the data under the corresponding assumptions. NIST describes a direct relationship between hypothesis tests and confidence intervals.
Using both can provide more information than reporting a p-value alone. A confidence interval can show the estimated direction, magnitude, and uncertainty of an effect.
This makes interval estimates useful when researchers want to communicate not only whether evidence exists but also how large the estimated effect may be.
Challenges and Limitations
Statistical inference is powerful, but it cannot remove uncertainty from imperfect data.
Sampling bias, measurement errors, missing observations, inappropriate assumptions, small samples, and confounding variables can all affect conclusions.
Researchers should also avoid treating statistical significance as proof of practical importance. A very large sample can detect a small difference that has little real-world impact, while a small study may fail to detect an important effect because it lacks sufficient statistical power.
Good inference therefore depends on thoughtful study design as much as mathematical calculation.
Conclusion
Statistical Inference provides a framework for learning about populations from sample data. Its major methods include point estimation, confidence intervals, hypothesis testing, sampling distributions, and statistical modeling.
The process begins with reliable data and an appropriate sampling strategy. Researchers then select methods that match their question and assumptions. Confidence intervals help quantify uncertainty, while hypothesis tests provide structured ways to evaluate claims.
Statistical inference is used throughout science, business, healthcare, education, manufacturing, economics, and data science. Understanding its principles helps readers interpret statistical evidence more accurately and recognize both the value and limitations of conclusions drawn from sample data.
Frequently Asked Questions
What is statistical inference?
Statistical inference is the process of using sample data, probability, and statistical methods to draw conclusions about a larger population.
What are the two main types of statistical inference?
Two major categories are estimation and hypothesis testing. Estimation focuses on determining population parameters, while hypothesis testing evaluates specific claims about those parameters.
What is a confidence interval?
A confidence interval is a range calculated from sample data that provides an interval estimate for an unknown population parameter. Its confidence level describes the long-run performance of the procedure.
What is hypothesis testing?
Hypothesis testing is a statistical procedure that uses sample evidence to evaluate a claim about a population. It generally involves a null hypothesis, an alternative hypothesis, sample data, a test procedure, and a conclusion.
Why is statistical inference important?
Statistical inference allows researchers to learn about populations without collecting data from every member. It helps quantify uncertainty and supports evidence-based conclusions across many fields.
Explore More: BTECH WORLD